
TripShot Insights
Clearer Data. Smarter Transit Decisions.
TripShot Insights gives transit agencies a clear, centralized view of the performance metrics and data that matter most. From the TripShot analytics portal, teams can quickly navigate to fixed-route, on-demand, FlexRide, and sustainability reporting.
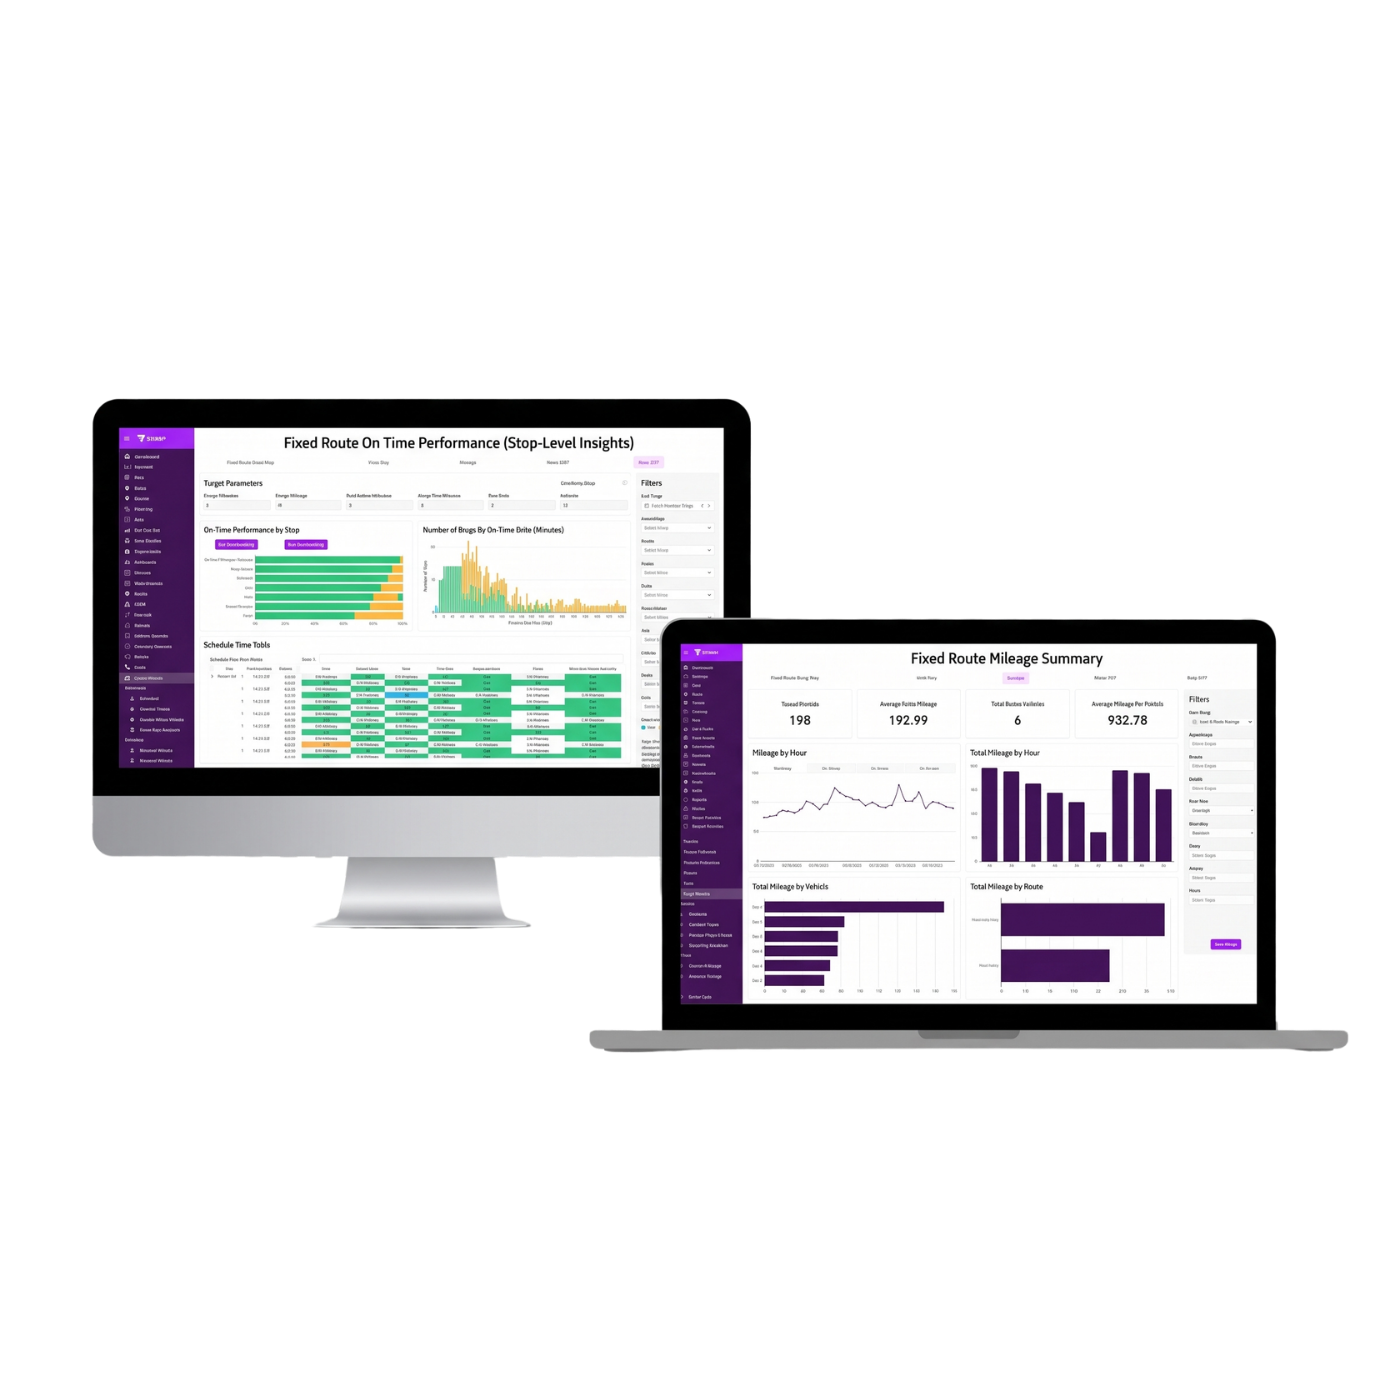
Why TripShot Insights
One consistent source of transit data and operational truth
Instead of piecing together data across disconnected systems, agencies can use TripShot Insights as a consistent source of operational truth to identify trends, improve service delivery, communicate performance, and make more informed decisions about resources and investments.
Dispatchers and operations
Faster access to service data
Get faster access to the data and details behind service performance.
Analysts and managers
Flexible, deeper reporting
Use flexible reporting and data filters that support deeper investigation.
C-level transit leaders
Performance insights
Get concise insights into transit performance, rider outcomes, efficiency, and sustainability.
ㅤ
Sustainability reporting that tracks measurable progress
The Emissions and Sustainability dashboard in TripShot Insights helps agencies measure the environmental impact of their service and understand how vehicles are being used.
- Emissions by Energy Type
- CO2 emissions and miles traveled over time
- CO2 emissions per passenger mile by vehicle
Emissions saved
Environmental impact of your service
ㅤ
Total CO2 emissions
Fleet-wide emissions in one place
ㅤ
Single-occupancy vehicles saved
Trips taken off the road
ㅤ
Vehicle utilization
How vehicles are being used
ㅤ
ㅤ
ㅤ
These sustainability insights help agencies move beyond broad sustainability goals and track measurable progress.
Operations teams
Identify opportunities to improve vehicle utilization and understand how service patterns affect emissions.
Reporting teams
Support grant applications, board updates, sustainability reporting, and community communications.
Executives
Connect transportation performance to broader environmental commitments, with evidence for decisions about fleet strategy, service planning, and future investments.
ㅤ
Get a clearer picture of your service
Uncover patterns, enhance service operations, share meaningful performance results, and confidently plan how to allocate resources and prioritize investments.
Fixed Route
Reporting and Insights
Use fixed-route data to track how scheduled service is deployed, how reliably it runs, and how riders use it.
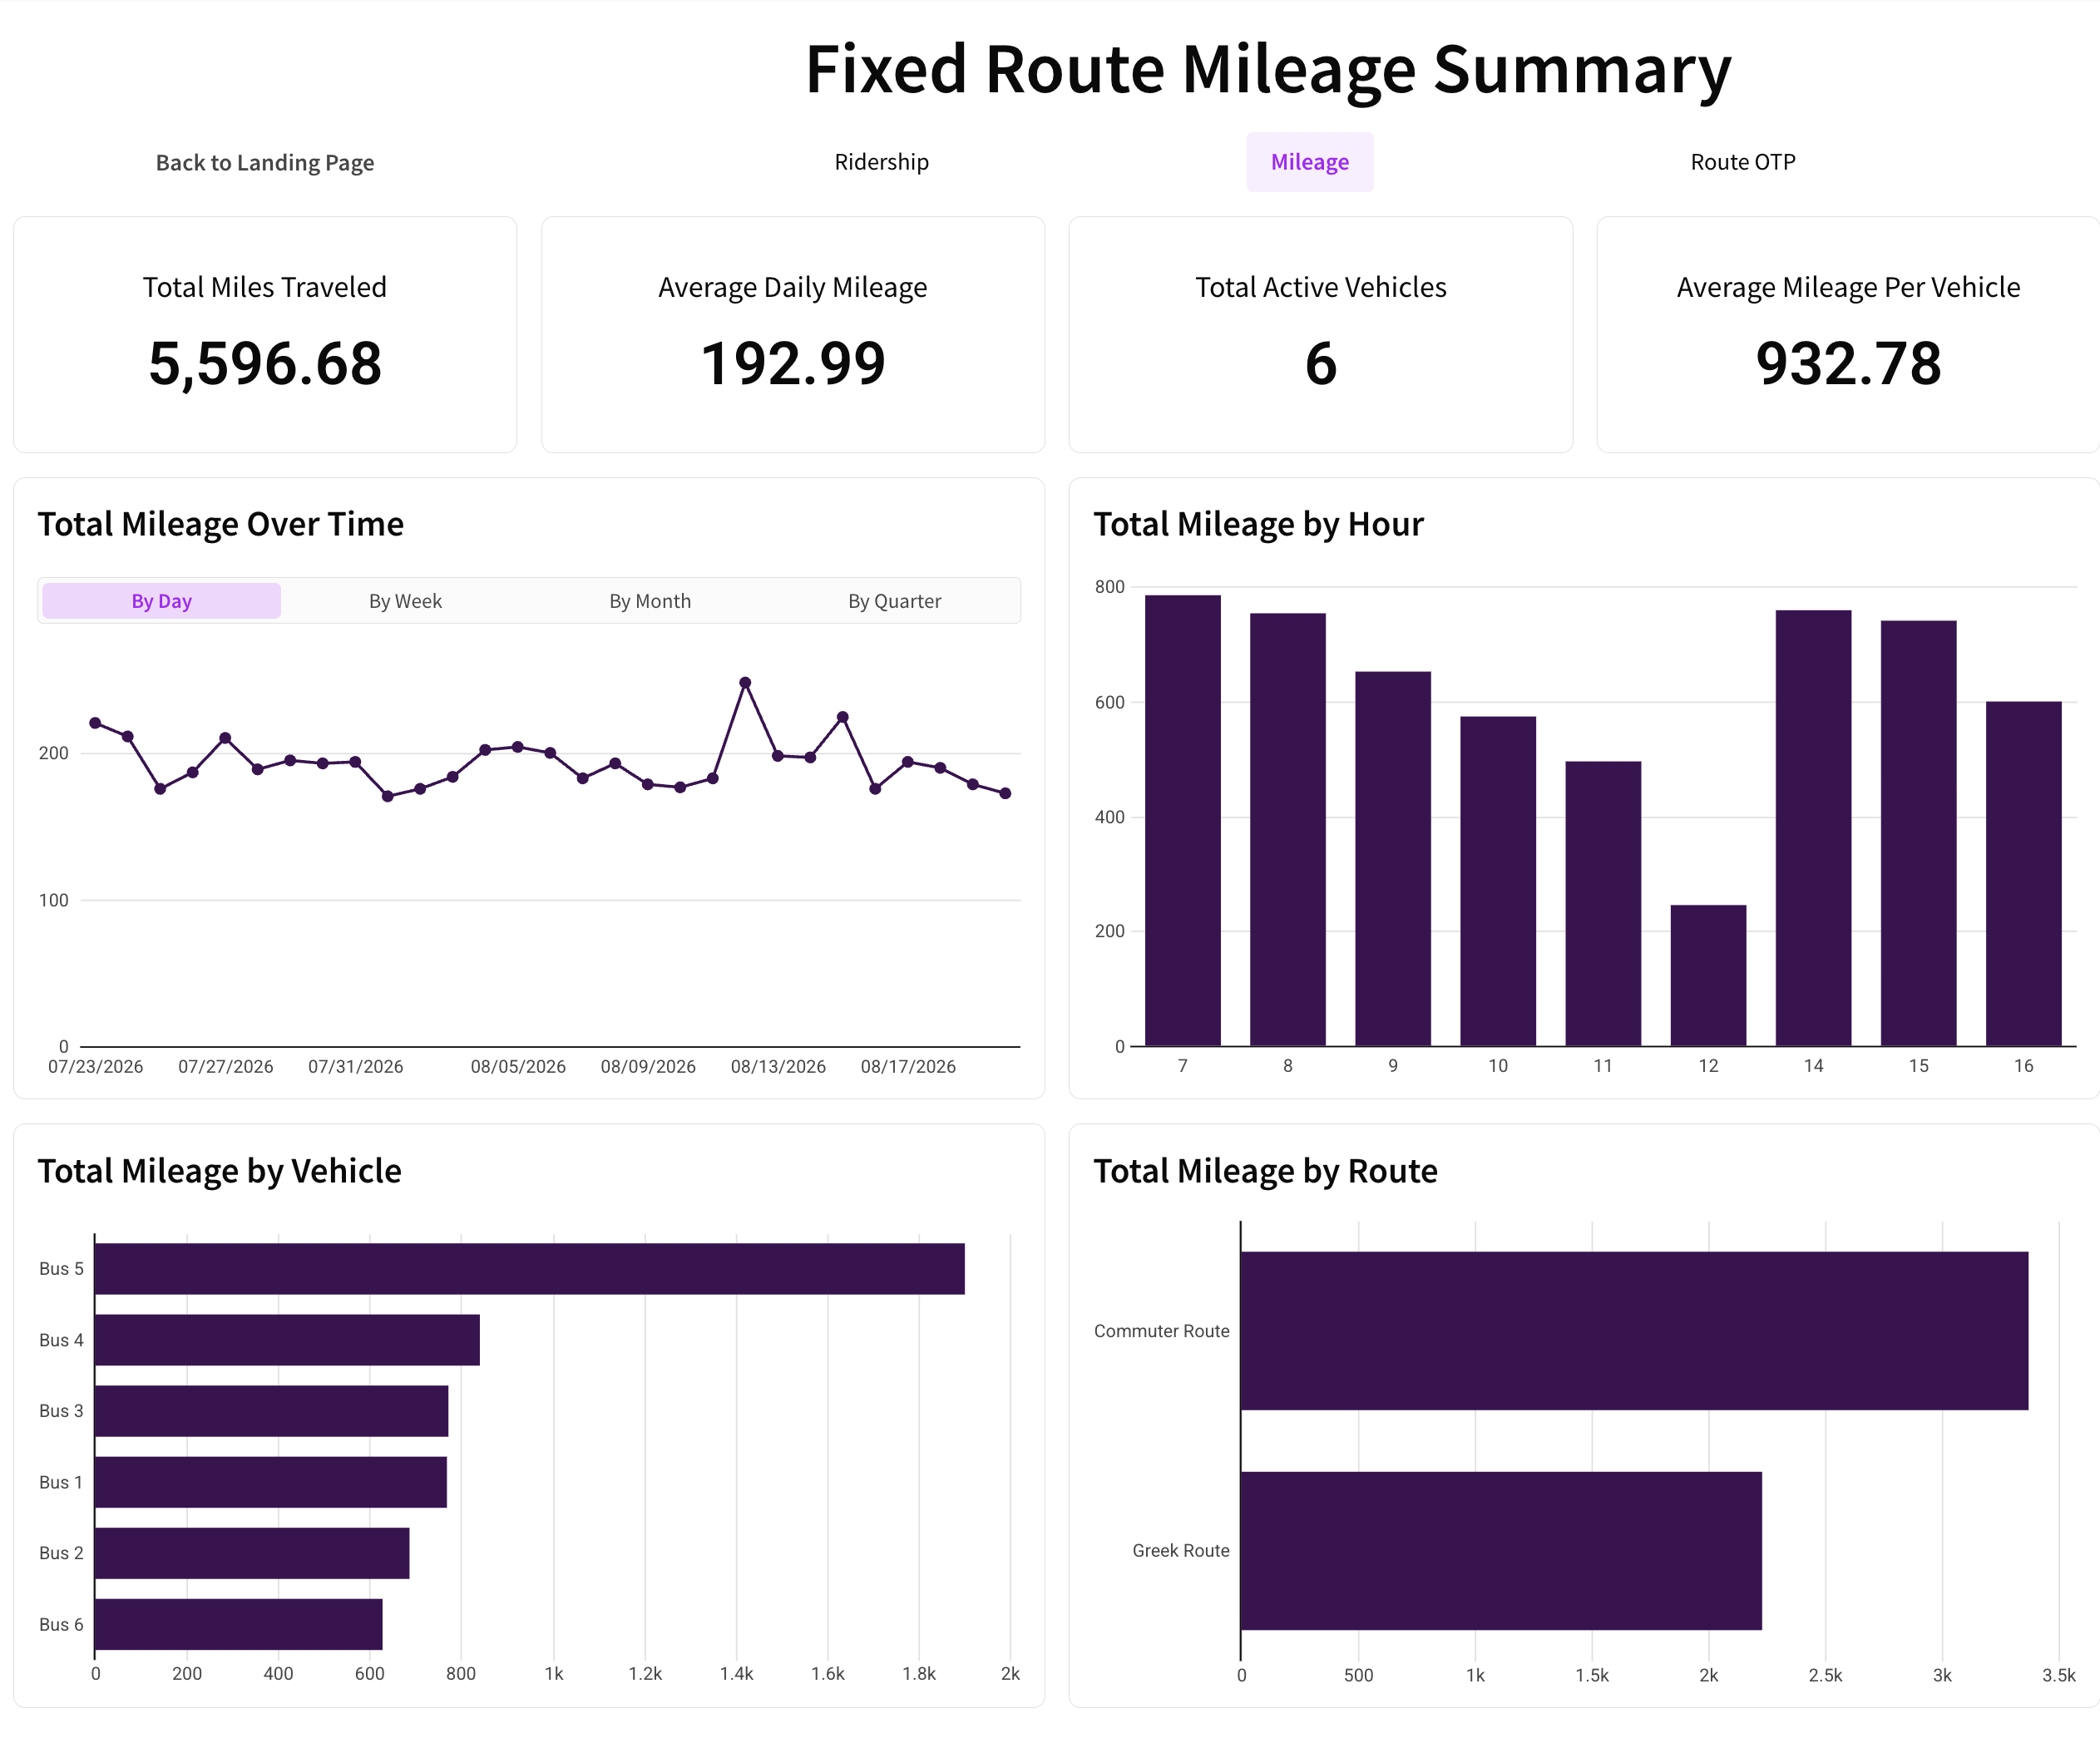
Mileage Summary
The Fixed Route Mileage Summary provides a practical view of how service resources are being deployed. Review total mileage data by day, week, month, or quarter, then examine the details by hour, vehicle, and route.
- ● Total miles
- ● Average daily mileage
- ● Active vehicles
- ● Mileage per vehicle
Dispatchers and operations managers
Spot unusual mileage patterns, identify vehicles or routes that may require attention, and understand how service is delivered throughout the day.
Planners and managers
Support more informed planning around vehicle allocation, scheduling, maintenance, and operating costs.
Senior transit leaders
See a clear connection between service levels, resource utilization, and the efficiency of the network.
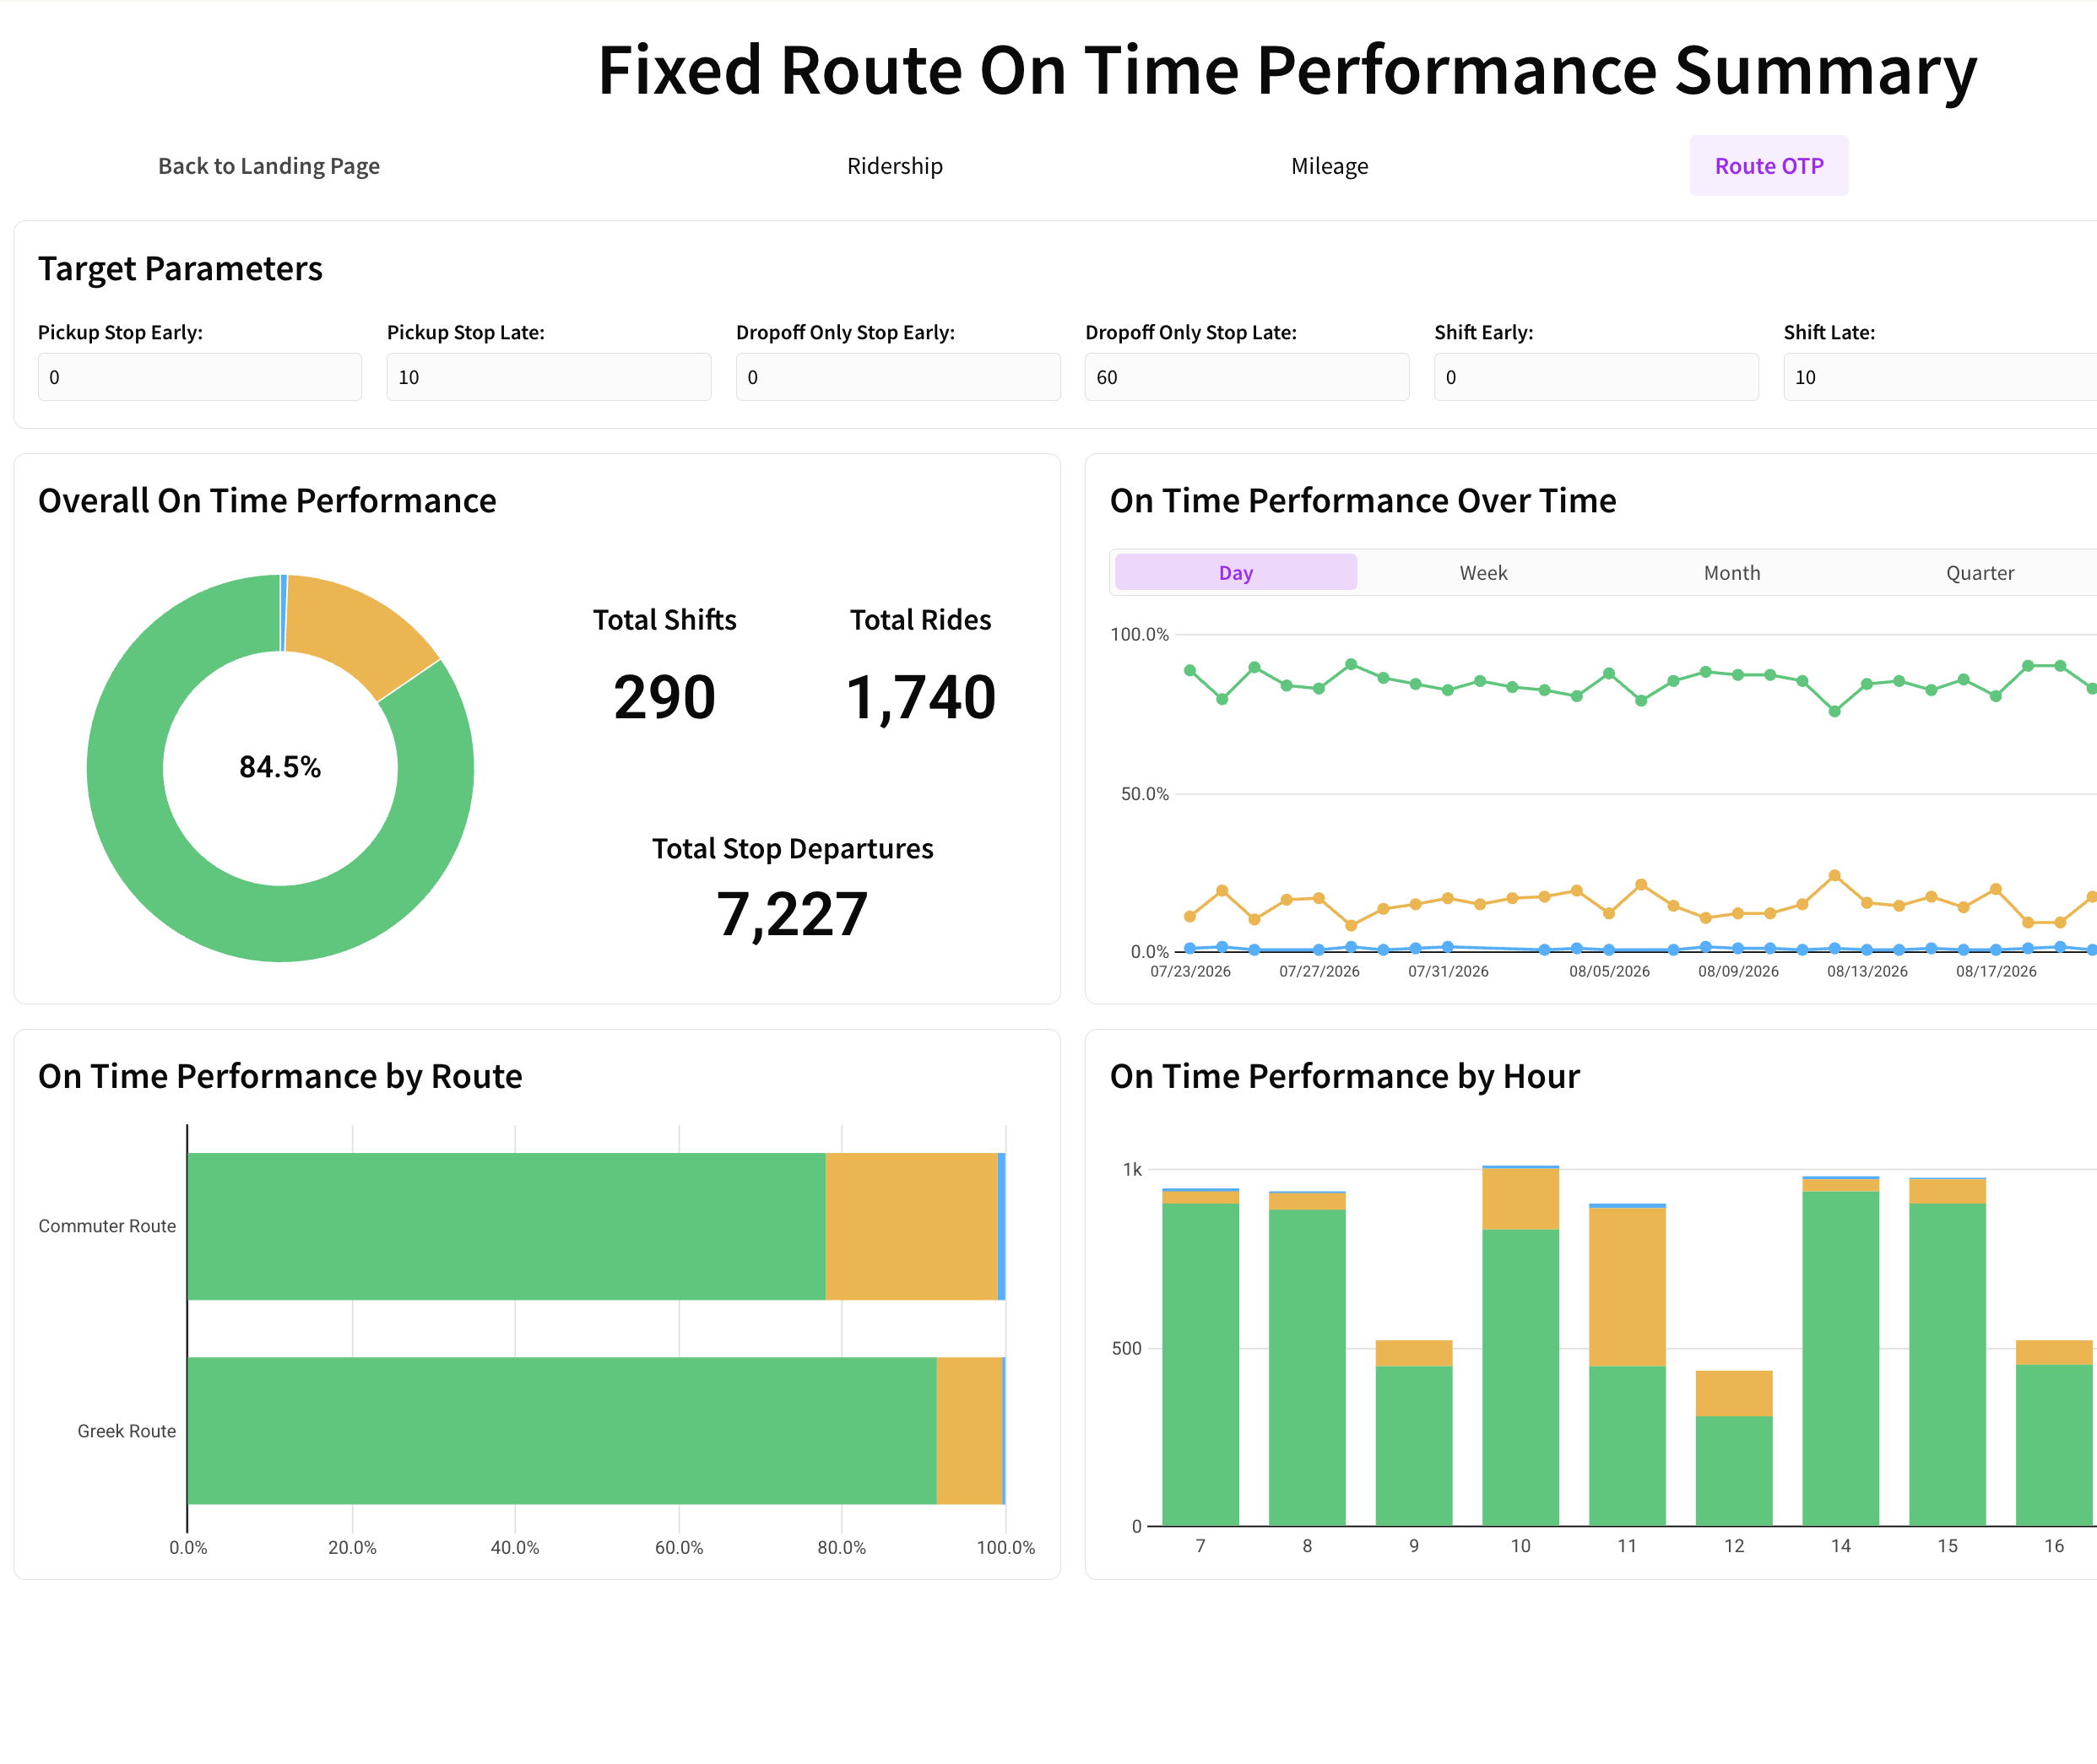
On-Time Performance Summary
An executive-ready view of schedule reliability that preserves the detail needed for operational follow-up. Define target parameters and review the overall distribution of early, late, and on-time departures, with performance trends over time, by route, and hour.
- ● Total shifts
- ● Total rides
- ● Total stop departures
Dispatchers
Use route- and hour-level views to recognize recurring service challenges.
Reporting teams
Create consistent performance updates from one shared summary.
Senior leaders
Quickly see whether on-time performance is improving, where reliability is falling short, and how performance compares across the network.
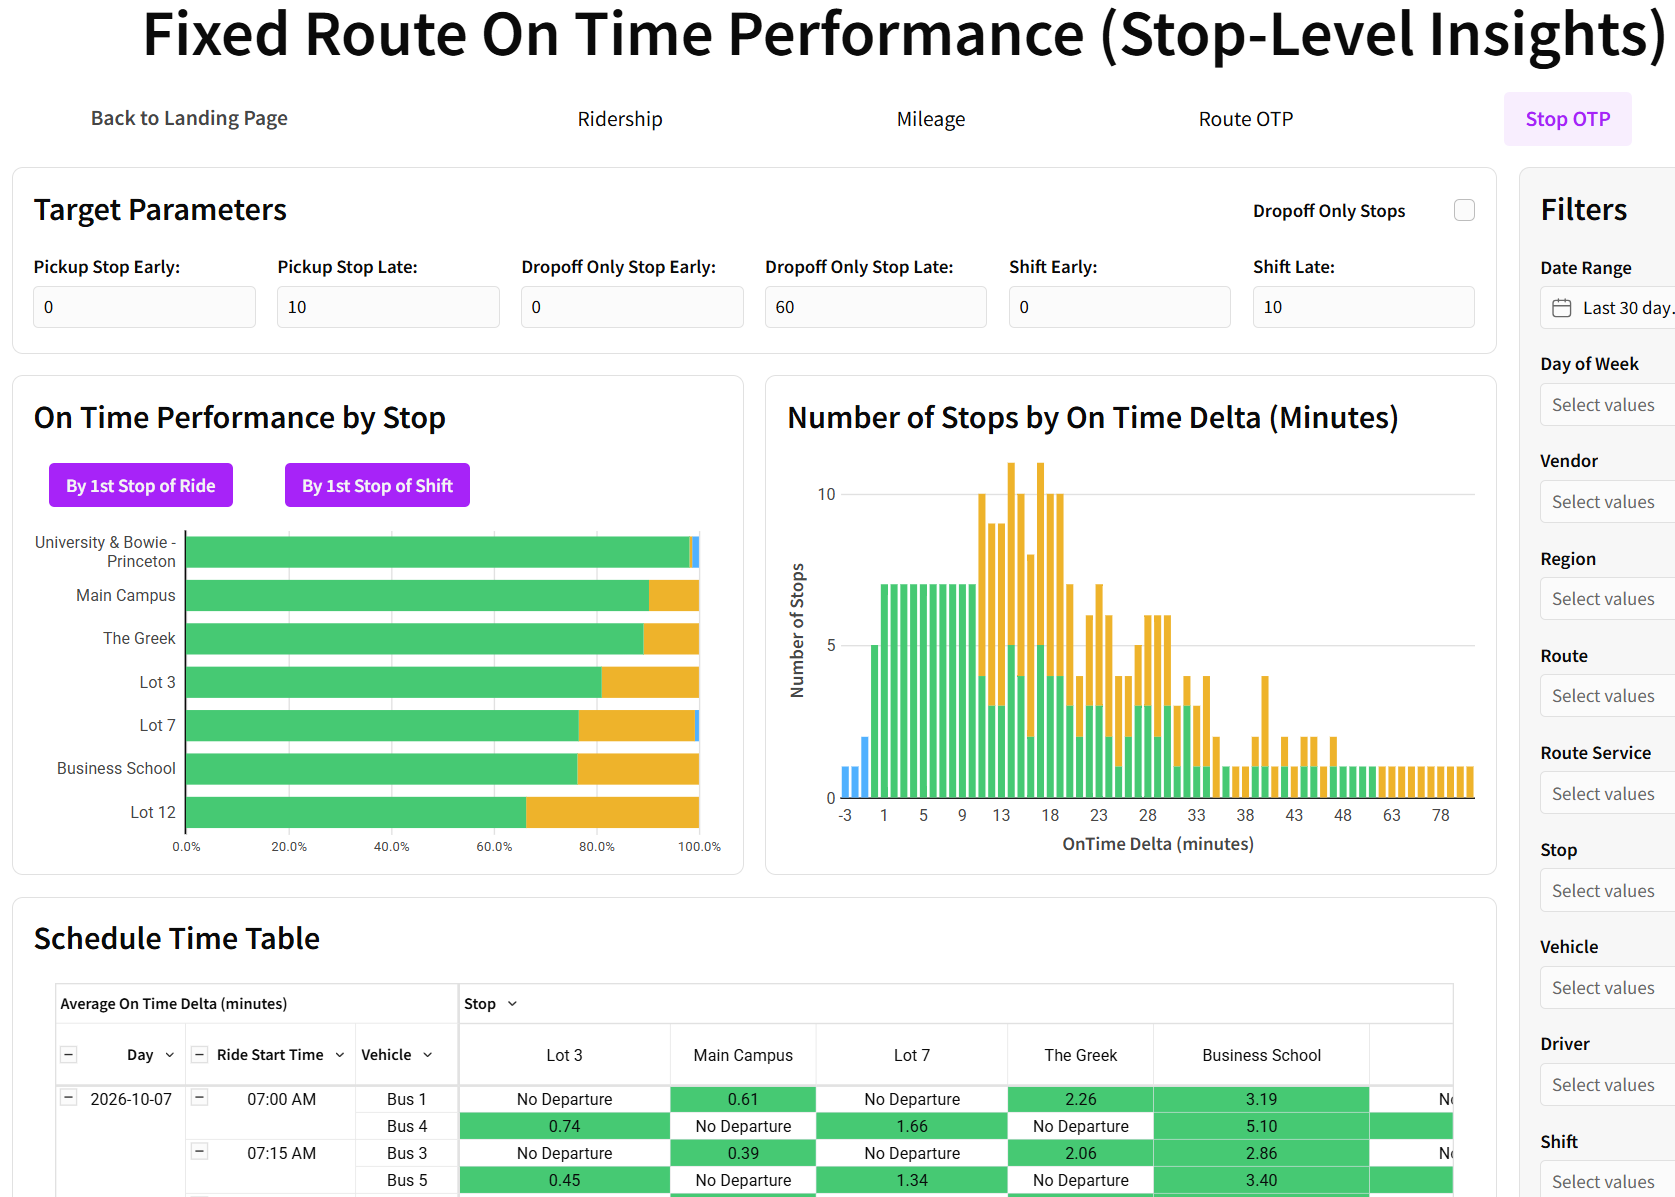
On-Time Performance: Stop-Level Insights
Understand not only whether service is on time, but where and when schedule performance changes. Set early and late windows in minutes, review the number of stops within each on-time delta, and use a detailed schedule timetable for stop-level timing.
- ● Early and late windows
- ● Stops by on-time delta
- ● Schedule timetable
C-level operators
Turn an overall performance metric into an actionable view of reliability, rider trust, service quality, and agency accountability.
Operations teams
Pinpoint recurring problem stops, identify patterns that require intervention, and support more informed real-time decisions.
Service planners and performance teams
Get the evidence needed to refine schedules, adjust recovery time, and prioritize operational improvements.
Turn Service Insights into Meaningful Improvements
Spot emerging patterns, strengthen service delivery, communicate outcomes, and prioritize resources where they matter most.
On Demand
Reporting and Insights
Use on-demand data to measure how dependably on-demand trips meet pickup expectations and how riders use flexible service.
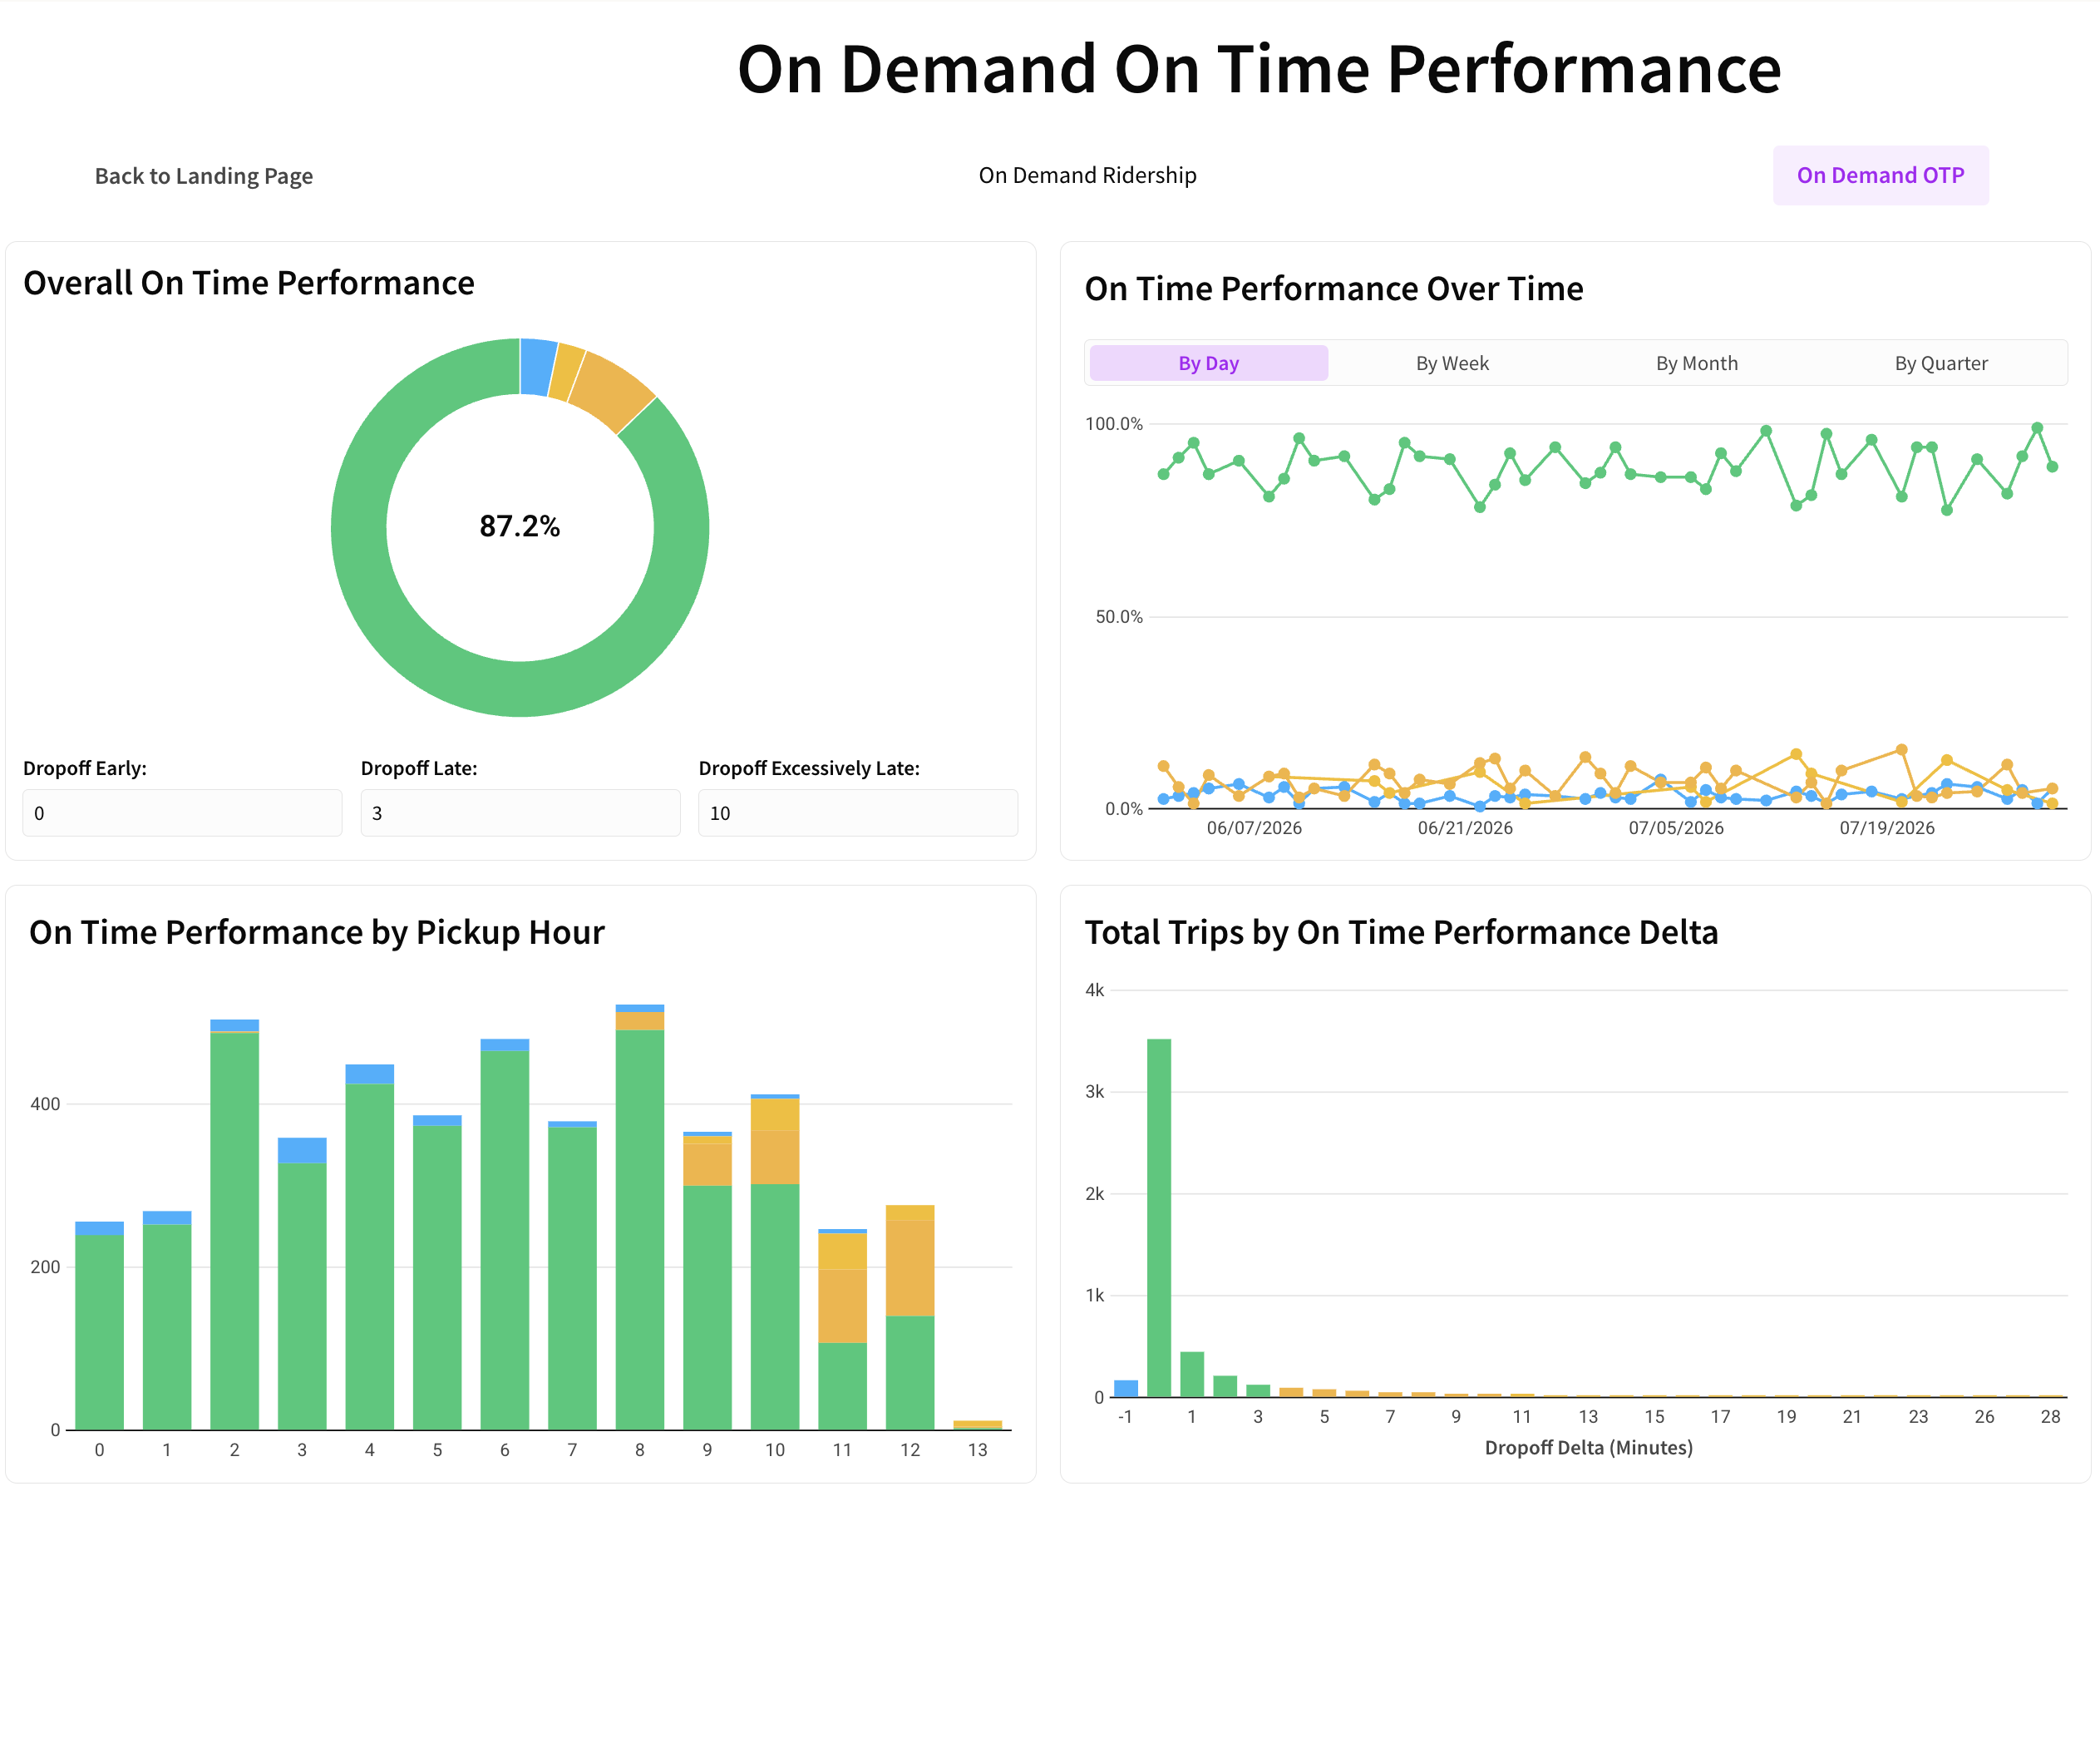
On demande On-Time Performance
See how reliably on-demand trips are meeting their pickup expectations. Review the overall distribution of on-time performance, track results by day, week, month, or quarter, analyze performance by pickup hour, and view total trips by on-time performance delta.
- ● On-time distribution
- ● Trips by on-time delta
- ● Performance by pickup hour
C-level transit operators
Get a clear measure of service dependability that connects operational performance with customer satisfaction and agency commitments.
Dispatchers
Reveal when demand, traffic, or capacity constraints are affecting service.
Operations managers
Support targeted changes to scheduling, dispatch practices, and service coverage.
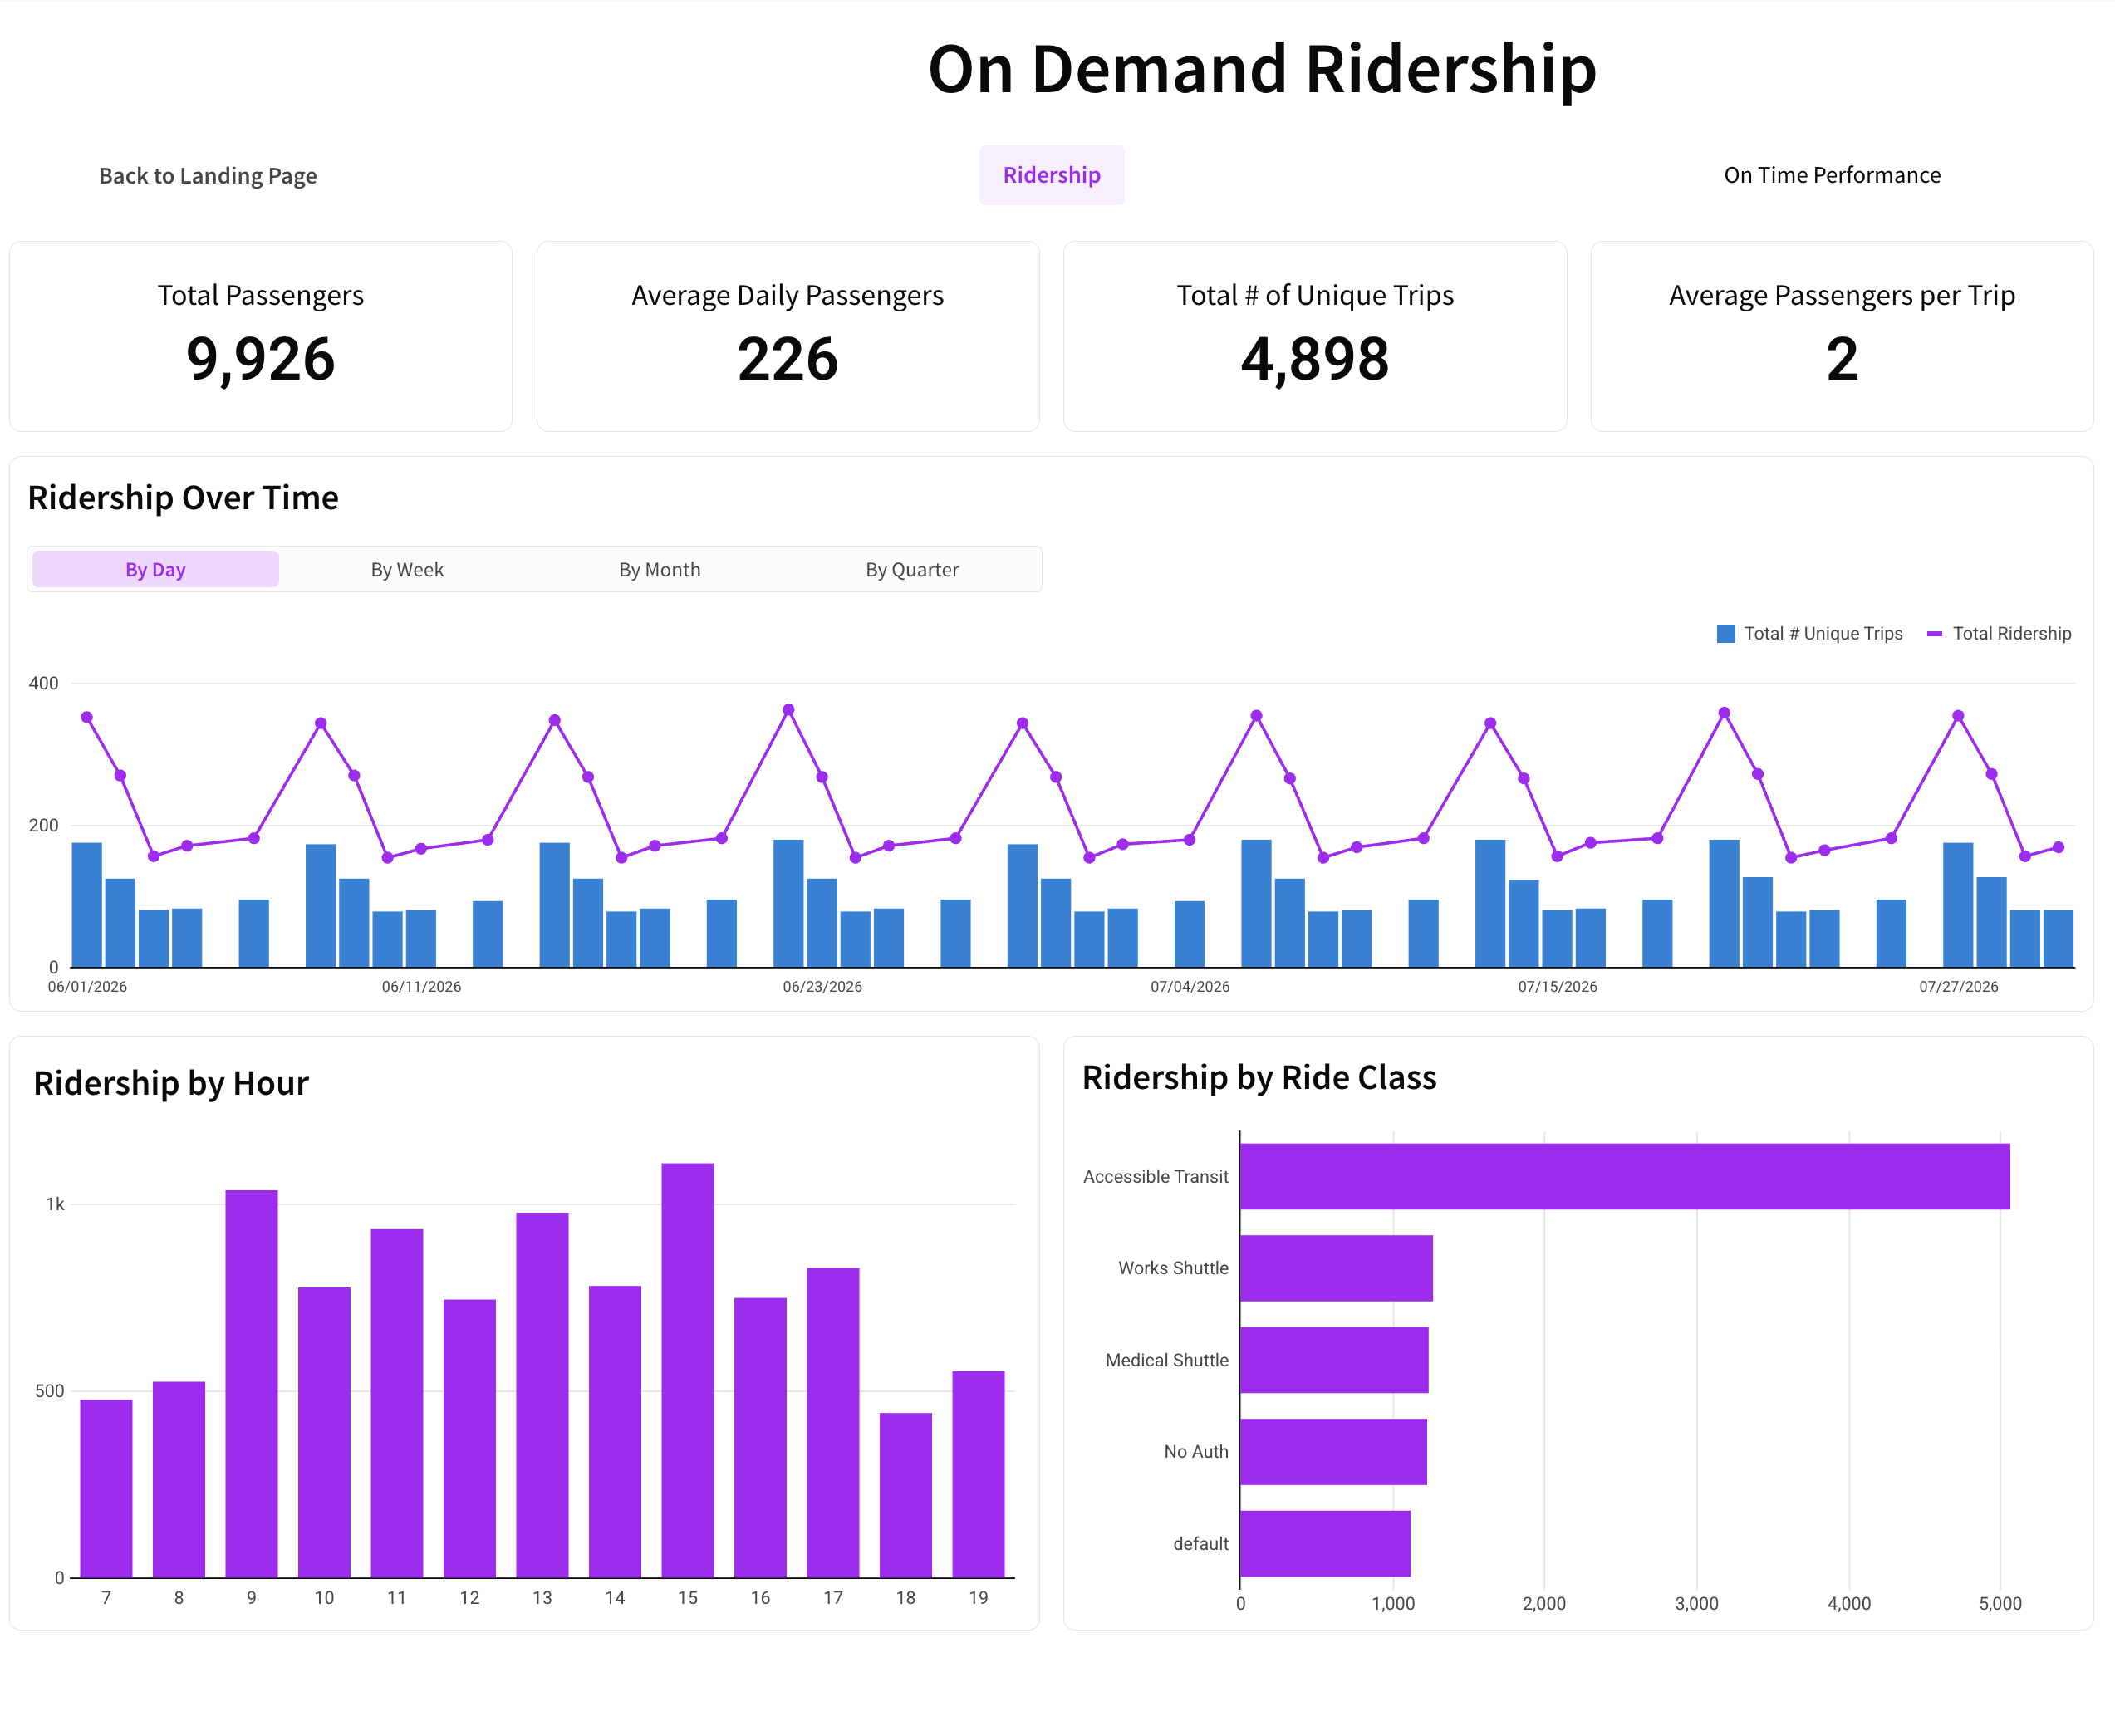
On Demand Ridership
Understand how flexible service is being used, with trend views by day, week, month, or quarter and ridership by hour and ride class.
- ● Total passengers
- ● Average daily passengers
- ● Unique trips
- ● Passengers per trip
Dispatchers and operations teams
Anticipate demand and support better capacity decisions.
Analysts
Compare ride classes and time periods to inform service planning.
Executives
Evaluate the reach, efficiency, and value of on-demand transportation.
Make every service decision count
Transform operational data into meaningful insights that help improve service quality, track progress, and guide investments.
FlexRide
Reporting and Insights
Use FlexRide request data to understand demand for flexible service and how effectively requests are being fulfilled.
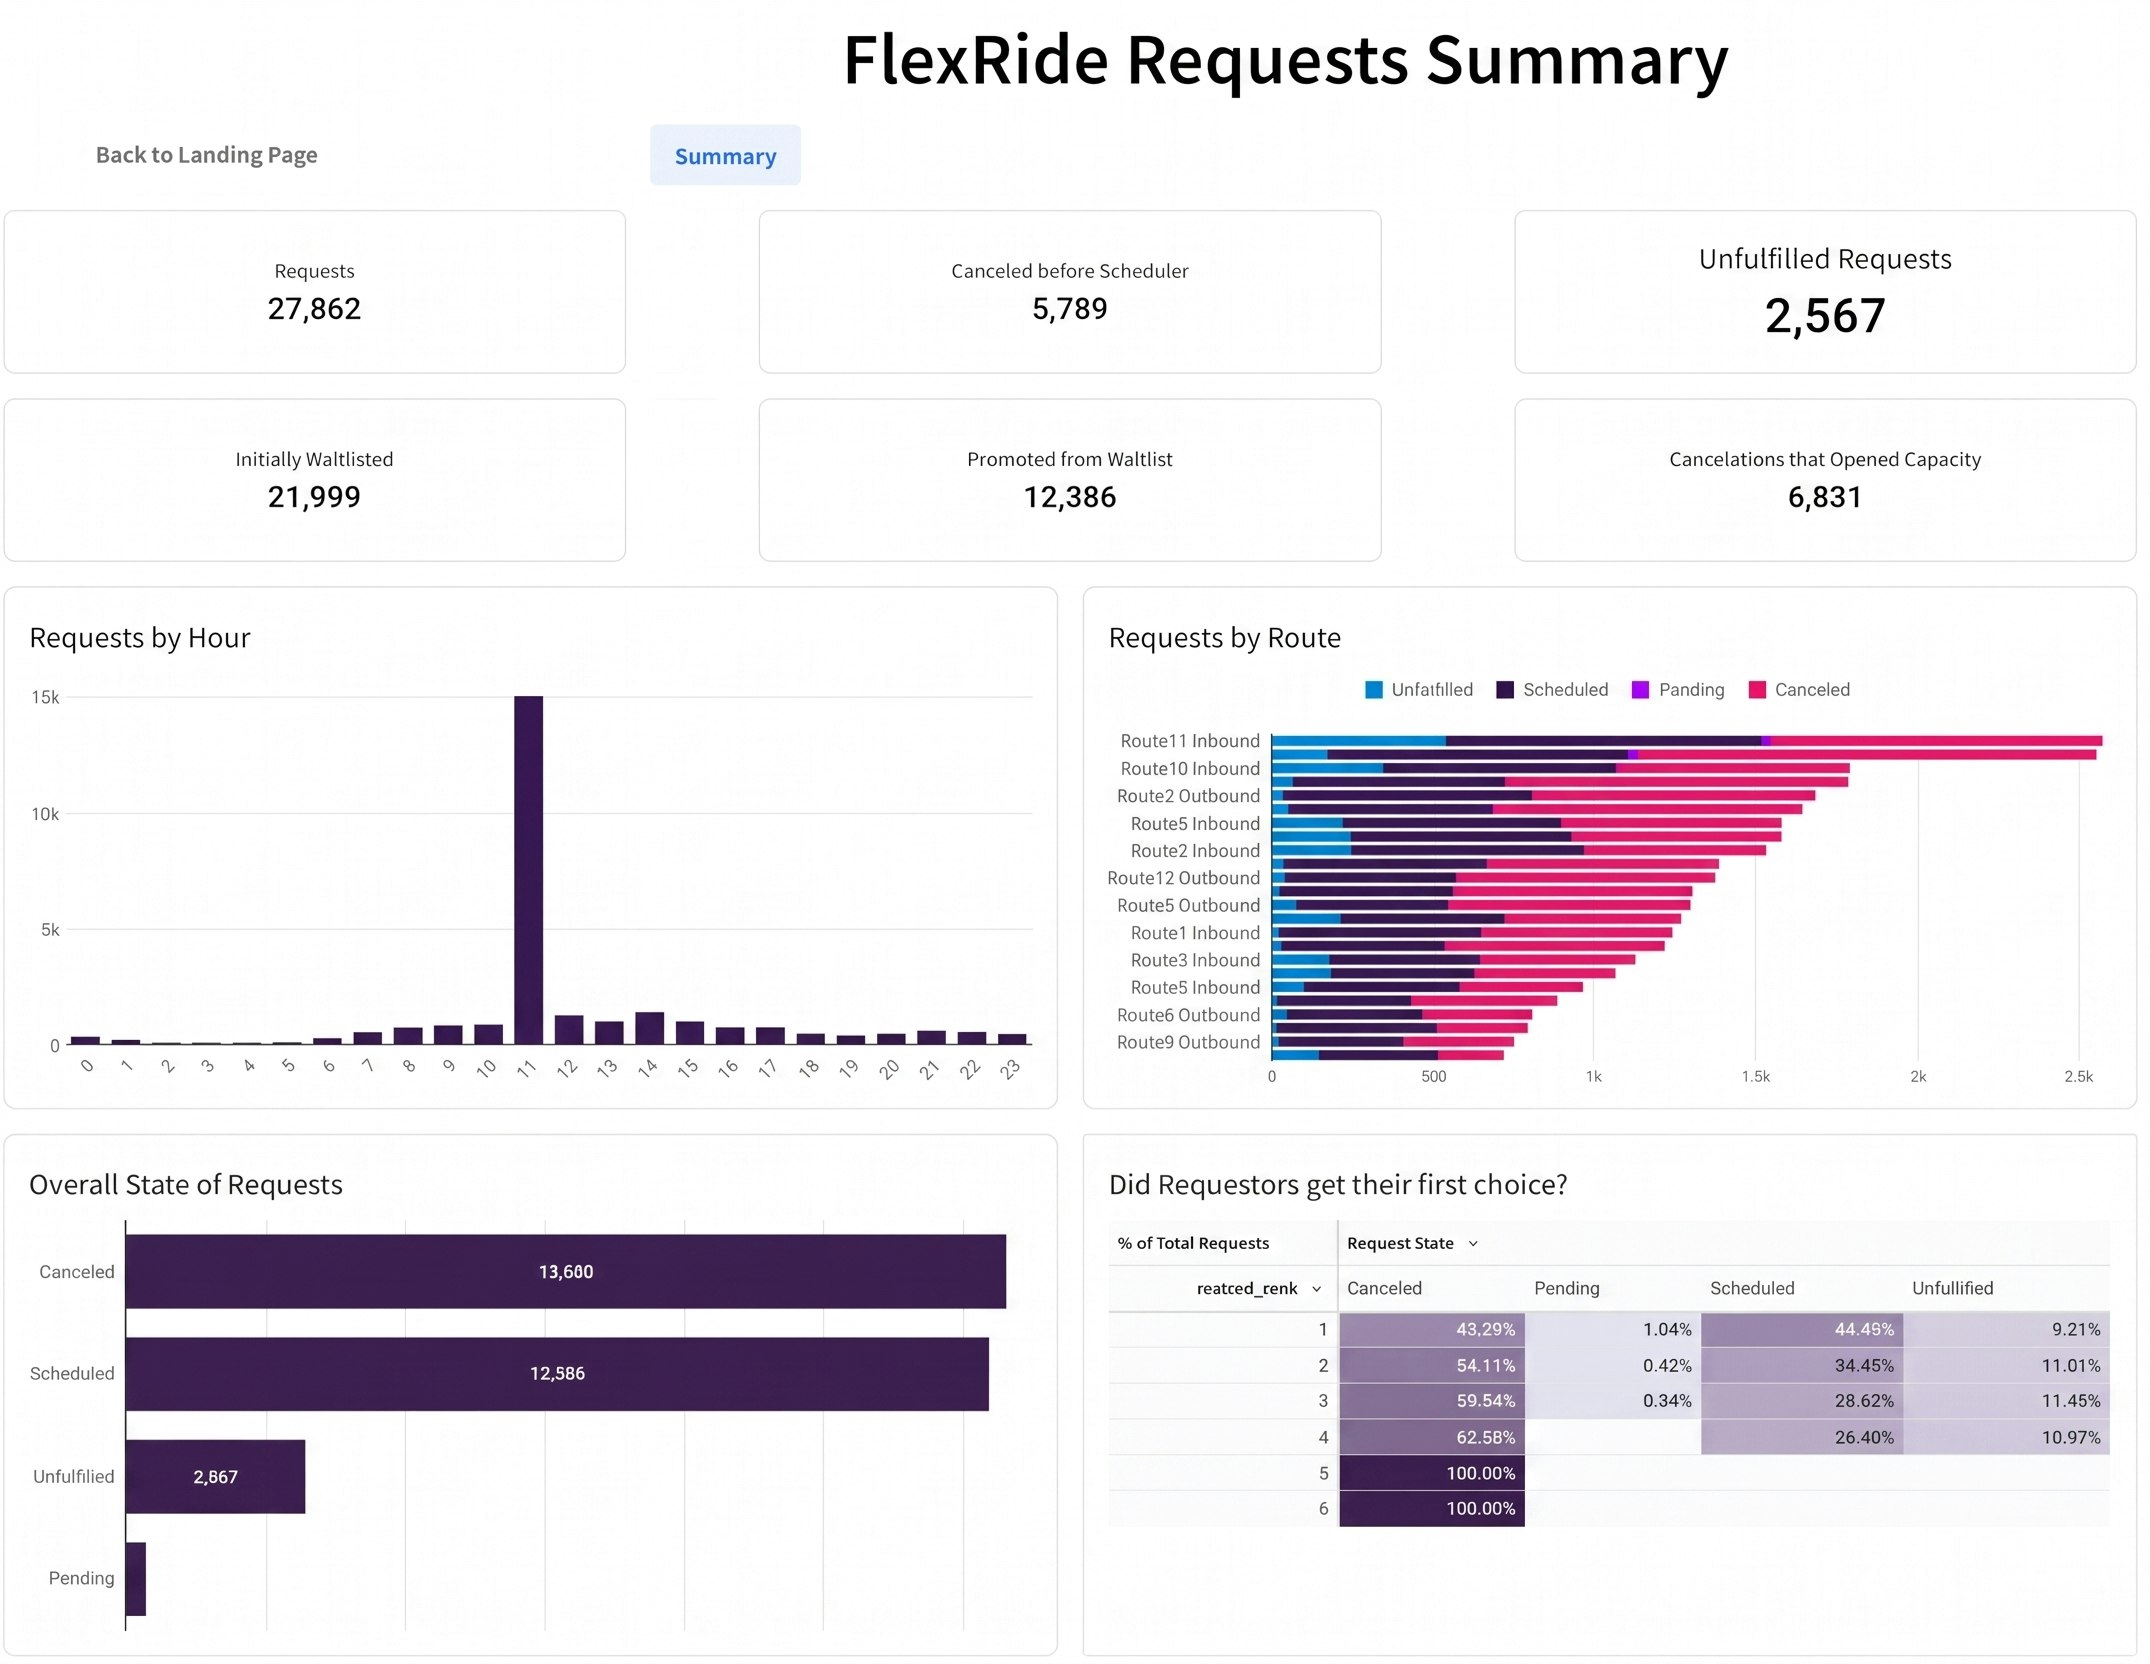
Requests Summary
Monitor demand for flexible service and how effectively requests are being fulfilled, from total requests and cancellations to waitlist activity and capacity opened by cancellations.
- ● Total requests
- ● Cancellations
- ● Unfulfilled requests
- ● Waitlist activity
- ● Capacity opened by cancellations
Operations teams
Monitor demand, identify service gaps, and respond to changes in request volume.
Planners
Evaluate whether available capacity is being used effectively and where adjustments may improve the rider experience.
Reporting teams and senior leaders
Get a measurable view of flexible-service performance to guide capacity, service design, and future program growth.
FAQ
TripShot Insights is the TripShot analytics portal that gives transit agencies a clear, centralized view of the performance data that matters most, with fixed-route, on-demand, FlexRide, and sustainability reporting in one place.
TripShot Insights includes Fixed Route Mileage, On-Time Performance, and Ridership reporting; On Demand On-Time Performance and Ridership reporting; a FlexRide Requests Summary; and an Emissions and Sustainability dashboard.
Dispatchers and operations teams get faster access to the data behind service performance, analysts and managers get flexible reporting for deeper investigation, and C-level transit leaders get concise insights into how service is performing.
Yes. The Insights filters panel lets users refine reporting by service, time, route, vehicle, or other operational dimensions without rebuilding reports manually.
Yes. The Emissions and Sustainability dashboard tracks emissions saved, single-occupancy vehicle trips saved, total CO2 emissions, and vehicle utilization, and its data can support grant applications, board updates, sustainability reporting, and community communications.
Better Insights. Better Service.
Identify trends, improve service delivery, communicate performance, and make more informed decisions about resources and investments.